Benchmarking no-tool tax-and-benefit estimation in frontier language models
Max Ghenis
Abstract
PolicyBench evaluates whether frontier language models can estimate household tax and benefit outputs from household facts without tools. This release covers the United States, drawing sampled households from the certified PolicyEngine populace microdataset, scored through policyengine.py 4.16.1. It evaluates 24 frontier models on 100 households across 18 output groups, and reports three complementary scores: an exact-match rate as the headline deployability bar (a prediction counts only if it matches the PolicyEngine reference to the dollar for amounts or to the eligibility flag for booleans), a within-1% hit rate as a near-miss-tolerant companion, and a continuous bounded score that awards partial credit for close answers. The headline is exact match on a household-impact-weighted leaderboard: 84% of US reference outputs are exact zeros, and the weighting concentrates scores in the high-dollar output groups a hedge-to-zero strategy cannot answer, so the top model leads an always-zero baseline of 66.9% weighted exact by 21.8 points (Section 3.1 details the construction). The manuscript snapshot is a 100-household public preview, not a protected held-out leaderboard: the current public scenario explorer exposes prompts and reference outputs, so open-set leakage is a central limitation of any public ranking. In the frozen snapshot used for this manuscript (2026-07-11), the top-scoring US model on exact match is GPT-5.6 Sol at 88.7%, while GPT-5.4 nano is lowest at 62.3%. Within model families, newer is not always stronger: Claude Opus 4.8 scores 72.6% exact, below the 77.4% of the earlier Claude Opus 4.7. Multi-step tax quantities and positive-dollar benefit cases are materially harder than zero cases. Every wrong cell is audited, with reference-suspect flags adjudicated against primary sources and engine traces; the frozen release has no known reference-computation defects, and every one of the 6,031 scored misses traces to a model-side failure (including the 1.2% of cells with a missing or unparsable answer, scored as misses rather than dropped). The live benchmark is available at https://policybench.org.
Introduction
Household tax-and-benefit estimation sits between arithmetic and policy discussion. Each case has numeric labels, but generating those labels requires filing status, household composition, income concepts, program thresholds, and jurisdiction-specific rules. PolicyBench measures whether models can map household records to those outputs.
Most current language-model evaluations do not test this mapping directly. General math benchmarks emphasize symbolic manipulation and exact final answers (Cobbe et al. 2021; Hendrycks et al. 2021), while generic question-answering benchmarks emphasize recall or instruction following. PolicyBench instead asks whether models can transform household facts into policy outputs without access to tools or simulators.
This matters for public-facing calculators, analyst workflows, and tax-preparation or screening systems. The benchmark is intended to separate verbal policy fluency from household-level quantitative prediction.
Related work
The most relevant prior work is tax and statutory reasoning. SARA frames statutory interpretation, including tax-relevant rule application, as a language-understanding problem (Holzenberger et al. 2021). LegalBench broadens this view and includes tax-oriented numeric tasks such as sara_numeric(Guha et al. 2023). RuleArena evaluates rule-guided reasoning in regulation-style settings (Zhou et al. 2025), and TaxCalcBench evaluates frontier models on tax calculation from structured return-like inputs (Bock et al. 2025). Shanahan et al. (2025) report a similar split on the Volunteer Income Tax Assistance (VITA) test: models do better on tax knowledge questions than on open-ended calculation tasks.
PolicyBench also sits within a broader literature on quantitative reasoning benchmarks. Canonical math evaluations such as GSM8K and MATH normalized exact final-answer scoring for numeric tasks (Cobbe et al. 2021; Hendrycks et al. 2021). Recent work has questioned pure exact-match scoring in numeric QA and temporal reasoning, arguing for error-aware metrics instead (Abbood et al. 2025). PolicyBench treats this as a measurement design choice rather than a forced pick, leading with a household-impact-weighted exact-match rate and reporting near-miss and bounded companions; the metric definitions, and the weighting that keeps the zero-inflated panel from rewarding hedge-to-zero answers, are specified in the benchmark design section.
Finance-domain benchmarks provide another relevant precedent. FinQA and TAT-QA both show that realistic quantitative reasoning often requires combining structured numbers with domain knowledge rather than solving stylized school-math problems (Chen et al. 2021; Zhu et al. 2021). PolicyBench differs in that its reference outputs are generated by executable tax-benefit microsimulation rather than annotated document questions, but the underlying motivation is similar: domain-specific quantitative reasoning deserves dedicated evaluation.
The nearest public-benefits benchmark is the concurrent Public Benefits Bench, built by Vals AI with the Center for Civic Futures and Code for America (Vals AI 2026). It evaluates models on 459 expert-validated SNAP guidance scenarios (230 in the published test set) spanning all 50 US states plus Guam and the Virgin Islands, and grades free-text answers against expert-written rubric criteria using a judge model that agreed with SNAP policy experts on 80.6% of grading decisions. Where PolicyBench isolates parametric knowledge by withholding tools, Public Benefits Bench varies tool access directly: across models, multi-turn conversation raises pass rates by roughly 7.6 percentage points and web search by about 6.9. The two benchmarks probe complementary failure surfaces — conversational guidance quality for a single program with tools available, versus no-tool numeric estimation across tax and transfer outputs scored deterministically against microsimulation references — and reach consistent conclusions. The best model passes 71.7% of rubric criteria under Public Benefits Bench’s strongest condition, and its authors conclude that “no general-purpose AI model performs well enough to be trusted with SNAP benefits guidance,” matching the deployability gaps PolicyBench reports for unaided calculation.
Finally, PolicyBench depends on two infrastructure literatures that are not themselves large language model (LLM) benchmarks. One is structured-output reliability, since the benchmark relies on multi-output JSON responses and parse coverage rather than free-form prose (Shorten et al. 2024). The other is tax-benefit microsimulation, where systems such as EUROMOD provide the methodological precedent for evaluating policy rules over household microdata (Sutherland and Figari 2013). There is also operational work on applying and evaluating AI systems in public-benefits settings, including caseworker-assist and Supplemental Nutrition Assistance Program (SNAP)-focused evaluations (Nava Labs 2026, 2025; ZenML LLMOps Database 2025). PolicyBench combines these strands into a public cross-model benchmark over household-level tax and benefit outputs.
Benchmark design
PolicyBench asks models to predict all benchmark outputs for a household in a single structured response. One response per household reduces repeated prompt cost and keeps the task at the household-return level rather than turning it into a sequence of unrelated one-output calls.
Headline metric: exact match
The headline metric is the exact-match rate: the share of requested outputs the model gets right to the dollar (or, for eligibility flags, to the boolean). This is the deployability bar. A tax filer, a benefit estimator, or a caseworker cannot ship “close” — a prediction off by $50 is no more usable than one off by $500, because neither matches the bottom line a downstream system or a household needs. For currency amounts, “exact” means within 1 currency unit of the reference value after numeric parsing. For binary outputs, “exact” means the parsed value is exactly the same 0/1 flag as the reference.
Exact match can be a deceptive headline in a zero-inflated panel — but only when the rate is computed unweighted. In the frozen manuscript snapshot, 84% of reference outputs are exact zeros: most sampled households are not eligible for any given program, owe no capital gains tax, do not phase into a refundable credit, and so on. A model that hedges to zero on every requested output earns full exact credit on every zero case, so a naive unweighted exact rate is dominated by those zeros — a hedge-to-zero model scores roughly 84% unweighted, leaving little room above the floor to separate models that actually understand the rules.
The public leaderboard corrects for this by household-impact weighting. Each output group’s weight is its population-average share of the household’s dollar stake, computed as |ref| / max(|household_net_income|, Σ |ref|) per source household and averaged with calibrated household weights over the full populace population (Section 5.5 gives the full construction). Zero-reference rows are not removed — every row carries its output group’s weight — but the weighting concentrates mass in high-dollar output groups, which are rarely zero, so the share of weight on zero-reference rows falls from their 84% row share to 66.9%. An always-zero baseline therefore scores 66.9% weighted exact rather than the 84% it earns unweighted, and the top model clears that baseline by 21.8 points — a margin comparable to within-1%. Across the 24-model roster, the weighted exact rate spreads about as widely as within-1% and ranks models in nearly the same order, so exact match discriminates between rule comprehension and zero-hedging while preserving the to-the-dollar deployability meaning.
The exact rate is aggregated to a household score and then to a country score, with the same population-derived output weights that the within-1% companion and the bounded score use. Equal household weight preserves comparability across scenarios and slices. The leaderboard reports US results on this fixed test set.
Near-miss companion: within 1%
The within-1% hit rate is the near-miss-tolerant companion to the headline: the share of requested outputs the model gets within one percent of the PolicyEngine reference value. For currency amounts, “within 1%” means |pred − ref| ≤ 0.01 × |ref| when the reference is nonzero and |pred| ≤ 1 (the same one-currency-unit absolute tolerance used by exact match) when the reference is zero. Binary outputs are requested as integer 0/1 eligibility flags and scored identically to the exact-match metric.
Within-1% relaxes the exact bar by tolerating rounding and small rate or parameter drift on positive-reference cases, so it credits a model that is consistently close but rarely to-the-dollar. It uses the same per-output household-impact weighting and the same household-equal aggregation as the headline exact rate, and it is reported alongside exact in every leaderboard table. Because both metrics share the weighting, the two rank models almost identically; within-1% sits a few points above exact and is the right view when near-miss accuracy, rather than strict deployability, is the question.
Secondary metric: bounded continuous score
PolicyBench also reports a bounded 0-100 score that awards smooth partial credit for close-but-not-exact amount answers. This is informative for tracking conceptual progress year over year and captures the qualitative gap between a model that is consistently close and one that is consistently far from the reference value. For amount variables, the row-level bounded score is max(0, 1 - |pred - ref| / |ref|) when the reference value is nonzero and 1{pred = 0} when the reference value is zero. For binary outputs, it uses exact 0/1 matching. Note that the zero-reference branch is stricter than the headline’s one-currency-unit tolerance — a $0.50 prediction on a zero-reference amount counts as exact but earns no bounded credit — so the bounded score is not a uniform relaxation of exact match. The exact, within-1%, and within-10% hit rates are reported separately as threshold diagnostics; they are not averaged to create the bounded score.
PolicyBench also tracks mean absolute error and related error metrics. These remain secondary diagnostics under the headline exact-match rate, the within-1% near-miss companion, and the bounded score. The three-metric design follows recent numeric-evaluation literature that questions pure exact-match scoring (Abbood et al. 2025) while keeping exactness as the production bar.
All requested US outputs are annual amounts or annual eligibility indicators for tax year 2026, scored under the tolerances defined above. Missing, unparseable, or non-0/1 answers receive zero score for that requested output.
Aggregation proceeds in three steps. First, each household-output prediction receives a 0-100 score. Second, each household receives one model score: requested output rows are weighted by output-group weights constructed from the full weighting population, then renormalized within the household over outputs that are actually requested for that household. Person-level coverage flags are scored at the person row; their output-group weight is split across the relevant people in the household and is based on PolicyEngine value proxies where available. Third, the country score averages those household scores with equal household weight. The leaderboard reports US results on this fixed test set. Equal-output-group scores and other alternative views are reported as sensitivity checks.
The benchmark requires each model response to include numeric answers and one explanation per requested output. Both the exact-match rate and the bounded score use only the numeric answers. Explanations are retained for scenario exploration and qualitative error analysis; they should not be interpreted as faithful traces of model reasoning.
Because explanations are required, the canonical task measures policy estimation under a public-facing structured-response contract, not isolated arithmetic accuracy. Prompt fairness is part of the benchmark contract. The current release uses one prompt template per country, with no model-specific tuning. Models receive the same household facts, the same requested outputs, and no web or tool access. The prompt states that unlisted numeric inputs are 0, unlisted boolean or status facts are false, and household characteristics are constant over the tax-benefit year. Provider-specific differences are limited to the response transport needed to obtain structured output and the reasoning configuration documented per model in Table 2: models whose provider enables reasoning by default run with extended thinking against a fixed shared completion budget, and no model receives reasoning-control parameters — every model in the frozen snapshot runs at its provider’s default reasoning configuration. Sampling parameters are never set; temperature and related decoding controls stay at provider defaults for every model. (An earlier June run pinned GPT-5.5’s reasoning effort to low; the pin was traced to a harness token-budget artifact and that run was replaced before the freeze, so the frozen GPT-5.5 wave is a default-effort run like every other model.)
Frozen snapshot and open-set status
Leaderboard positions are version-sensitive, so manuscript claims refer to the frozen source-run exports in Table 1 rather than to the live site. The committed source-run exports are the manuscript artifacts. The public site exposes the current prompts, predictions, explanations, and reference outputs for transparency. This makes the public leaderboard open-set: models, model providers, or benchmark users could learn from the released cases before later runs. Protected leaderboard claims would require a separate held-out or rotating set.
No tools, no web access; structured responses covering every requested output
Response contract
Numeric answer and non-empty explanation for every requested output
Table 2: Model run configuration in the frozen manuscript snapshot. Every model uses its provider’s structured-output transport with no external tools, provider-default temperature and sampling, and the identical prompt template; the reasoning column is the only per-model configuration.
Model
PolicyBench ID
Provider ID
Parsed
Reasoning setup
Claude Fable 5
claude-fable-5
claude-fable-5
1,984/1,984
extended thinking on (model default); thinking and answer share a 16,384-token completion budget
Claude Haiku 4.5
claude-haiku-4.5
claude-haiku-4-5-20251001
1,984/1,984
no reasoning parameters sent (provider default)
Claude Opus 4.7
claude-opus-4.7
claude-opus-4-7
1,984/1,984
no reasoning parameters sent (provider default)
Claude Opus 4.8
claude-opus-4.8
claude-opus-4-8
1,984/1,984
no reasoning parameters sent (provider default)
Claude Sonnet 4.6
claude-sonnet-4.6
claude-sonnet-4-6
1,984/1,984
no reasoning parameters sent (provider default)
Claude Sonnet 5
claude-sonnet-5
claude-sonnet-5
1,984/1,984
extended thinking on (model default); thinking and answer share a 16,384-token completion budget
DeepSeek V4 Pro
deepseek-v4-pro
deepseek/deepseek-v4-pro
1,984/1,984
no reasoning parameters sent (provider default); reasoning and answer share a 16,384-token completion budget
Gemini 3 Flash Preview
gemini-3-flash-preview
gemini/gemini-3-flash-preview
1,984/1,984
no reasoning parameters sent (provider default)
Gemini 3.1 Flash Lite Preview
gemini-3.1-flash-lite-preview
gemini/gemini-3.1-flash-lite-preview
1,984/1,984
no reasoning parameters sent (provider default)
Gemini 3.1 Pro Preview
gemini-3.1-pro-preview
gemini/gemini-3.1-pro-preview
1,984/1,984
no reasoning parameters sent (provider default)
Gemini 3.5 Flash
gemini-3.5-flash
gemini/gemini-3.5-flash
1,984/1,984
no reasoning parameters sent (provider default)
GLM-5.2
glm-5.2
openrouter/z-ai/glm-5.2
1,845/1,984
no reasoning parameters sent (provider default); reasoning and answer share a 16,384-token completion budget
GPT-5.4 mini
gpt-5.4-mini
gpt-5.4-mini
1,984/1,984
no reasoning parameters sent (provider default)
GPT-5.4 nano
gpt-5.4-nano
gpt-5.4-nano
1,984/1,984
no reasoning parameters sent (provider default)
GPT-5.5
gpt-5.5
gpt-5.5
1,984/1,984
no reasoning parameters sent (provider default); reasoning and answer share a 16,384-token completion budget
GPT-5.6 Luna
gpt-5.6-luna
gpt-5.6-luna
1,984/1,984
no reasoning parameters sent (provider default); reasoning and answer share a 16,384-token completion budget
GPT-5.6 Sol
gpt-5.6-sol
gpt-5.6-sol
1,984/1,984
no reasoning parameters sent (provider default); reasoning and answer share a 16,384-token completion budget
GPT-5.6 Terra
gpt-5.6-terra
gpt-5.6-terra
1,984/1,984
no reasoning parameters sent (provider default); reasoning and answer share a 16,384-token completion budget
Grok 4.3
grok-4.3
xai/grok-4.3
1,984/1,984
no reasoning parameters sent (provider default)
Grok 4.5
grok-4.5
xai/grok-4.5
1,984/1,984
no reasoning parameters sent (provider default); reasoning and answer share a 16,384-token completion budget
Grok Build 0.1
grok-build-0.1
xai/grok-build-0.1
1,984/1,984
no reasoning parameters sent (provider default)
Kimi K2.6
kimi-k2.6
openrouter/moonshotai/kimi-k2.6
1,558/1,984
no reasoning parameters sent (provider default); reasoning and answer share a 16,384-token completion budget
MiniMax M3
minimax-m3
openrouter/minimax/minimax-m3
1,984/1,984
no reasoning parameters sent (provider default); reasoning and answer share a 16,384-token completion budget
Qwen3.7-max
qwen-3.7-max
openrouter/qwen/qwen3.7-max
1,984/1,984
no reasoning parameters sent (provider default); reasoning and answer share a 16,384-token completion budget
Data and scenario construction
United States
The US benchmark is built from the certified PolicyEngine populace dataset (populace_us_2024) using PolicyEngine US. The dataset contains 160,858 people in 75,112 households, with household, tax-unit, SPM-unit, family, marital-unit, and person records for PolicyEngine calculations. The sampled households are filtered to keep a single-tax-unit, single-family, single-Supplemental Poverty Measure (SPM)-unit structure with at least one adult and a supported filing status. Of the 75,112 households, 63,128 (84.0%) pass the filter and form the eligible draw (this filter-pass rate is coincidentally close to the 84% zero-output share discussed under the benchmark design; the two figures are unrelated). The 16.0% excluded by the filter include multi-tax-unit households (e.g., adult roommates), multi-family households, multi-SPM-unit households, and households whose head reports a filing status outside the supported set. These excluded compositions are exactly the kind of cases where federal/state credit allocations and benefit-unit rules become hardest, so the eligible draw is a tractable subset rather than the full distribution of US households. Prompts include nonzero promptable raw inputs across relevant entities rather than a hand-curated summary, so the models see many of the same facts the simulator receives. Filing status is not stated in the prompt; the reference computation infers it from tax-unit role flags. Models therefore see the same household facts that drive the reference filing-status assignment, but they do not receive that assignment as a label.
The current US release requests 18 scored output groups spanning federal income tax, refundable credits, payroll and self-employment tax, state and local income tax, Supplemental Nutrition Assistance Program (SNAP), Supplemental Security Income (SSI), Temporary Assistance for Needy Families (TANF), school-meal eligibility, and person-level coverage eligibility for the Special Supplemental Nutrition Program for Women, Infants, and Children (WIC), Medicaid, the Children’s Health Insurance Program (CHIP), Medicare, Head Start, and Early Head Start; several of these categories span two scored groups each (federal and state refundable credits, payroll and self-employment tax, state and local income tax, free and reduced-price school meals), which is how the named categories reconcile to the 18 output groups. The source run also requested the Affordable Care Act (ACA) Premium Tax Credit (PTC), but explanation audits showed that the prompt could be misleading when households lacked plan-specific Marketplace information. We therefore preserve those raw responses but exclude PTC from the canonical scored leaderboard until the prompt contract is revised.
The output scope is intentionally narrower than the full PolicyEngine model. Table 3 summarizes the inclusion rule. The benchmark asks for WIC eligibility rather than a WIC dollar amount; WIC dollar values are used only as impact-weight proxies for coverage flags, not as requested model outputs.
Table 3: Output-selection rationale.
Scope decision
Rationale
Included
Direct tax, credit, benefit, health-support, and coverage outputs that a household-facing model could plausibly be asked to estimate from household facts.
Excluded
Intermediate tax bases, payroll subcomponents, and outputs that mainly require unavailable history, restricted local market data, restricted program-administration data, or take-up assignment rather than rule calculation.
Binary coverage outputs
Requested as 0/1 eligibility flags and scored as classification tasks; their dollar values are used only as impact-weight proxies, not as requested model outputs.
WIC
The benchmark asks for person-level WIC eligibility. It does not ask models to estimate a WIC dollar amount.
Reference-output credibility
PolicyBench treats PolicyEngine outputs as benchmark reference outputs, not as administrative records. The reference source is nevertheless stronger than an ad hoc answer key: PolicyEngine is open source, used for household calculators and reform analysis, and externally checked in specific domains. No. 10 Downing Street’s data science team adapted PolicyEngine’s open-source microsimulation model for experimental policy simulation, with validation against external projections before use (Woodruff 2026; Ghenis 2026). In the US, PolicyEngine (2024) reports matching the National Bureau of Economic Research (NBER) TAXSIM-35 model (Feenberg and Coutts 1993) to the cent on the vast majority of cases for the 2021 tax year across hundreds of thousands of tax units per state, with state-specific differences documented in the integration tests. We do not restate that comparison as a single percentage because the published source uses qualitative phrasing rather than a headline accuracy number. PolicyEngine has also signed a memorandum of understanding (Ghenis and Makarchuk 2025) with the Federal Reserve Bank of Atlanta for future validation work against its Policy Rules Database (2026). The Atlanta Fed sources are a caveat rather than evidence of completed validation for this benchmark: they document planned collaboration and the comparison source, not finished checks of the frozen PolicyBench outputs. Taken together, these sources support using PolicyEngine as a transparent reference implementation with partial external validation, but they do not validate every benchmark output.
This does not make PolicyEngine infallible, so we treated the reference outputs as claims to be attacked rather than assumptions. Across development and three audit waves, every wrong cell received a model-assisted review, and every case in which a reviewing model suspected the reference itself was adjudicated by hand against primary sources — statutes, regulations, and published program parameters — and against the engine’s computation traces. Reviewers raised 35 reference-suspect flags in total. Thirty-one dissolved under adjudication, with the reviewer’s hypothesis failing against a primary source (stale thresholds, missed program mergers, missed federal-conformity elections, misread eligibility-income definitions) or against the engine trace. Four were genuine: two Head Start eligibility flags and one New Jersey state income tax cell reflected policyengine-us defects (an age-window bound and a filing-threshold floor the benchmarked path bypassed), and one SNAP cell rested on a scenario whose encoded inputs did not match the disability status its prompt implied. The engine defects were fixed upstream (policyengine-us #8845 and #8846, plus #8844, found in the same review but affecting no benchmark cell), and this snapshot’s reference outputs are generated with the fixed engine, policyengine-us 1.755.4. The mis-encoded scenario is disclosed under Limitations pending the next scenario refresh. The asymmetry of this record is itself evidence about the reference: even among the cells the reviewing models found most suspicious, 31 of 35 flags (89%) resolved to model-side errors, set against thousands of confirmed model errors overall and four reference defects. Table 4 summarizes the reviewed discrepancy classes and outcomes; no unresolved reference-computation defect is known in the frozen snapshot.
The audit tooling itself required hardening, which we report because it changes how much the annotations can be trusted. The derivation narratives displayed alongside reference values are generated from engine computation traces. After earlier model-written narratives were found to misattribute eligibility pathways, mechanical validators now enforce that each narrative states the engine’s actual mechanism — for example, that a child ineligible for CHIP because they qualify for Medicaid is never described as failing a CHIP income test. The failure-audit judge reads these grounded narratives together with engine facts and must return a per-model diagnosis naming the specific rule or computation the model missed. It is barred from re-adjudicating the reference in prose: hedged or reference-adjudicating verdicts are mechanically rejected and re-judged, and genuine reference doubt is routed to a structured flag that triggers the manual adjudication described above.
After freezing the snapshot and completing response-contract repairs, we annotated every wrong model-output row and every scenario-output case with at least one wrong row. Table 5 reports that all 6,031 rows receiving less than full score carry row-level and case-level annotations. Every row resolves to one of two final classes: llm_error (a substantive miscalculation, with a per-model diagnosis naming the rule or computation the model missed) or parse_contract_failure (a missing or unparsable answer, classified deterministically). No wrong row remains classified as a prompt ambiguity, unresolved reference issue, or needs-review item, and zero rows carry a standing reference-suspect flag. The audit pipeline is model-assisted with developer adjudication of every reference-suspect flag rather than independent external validation, but it is exhaustive over scored misses in the frozen snapshot.
Table 4: Development discrepancy review before the frozen snapshot.
Discrepancy class
Review outcome
US federal credits
Reviewed cases where explanations omitted EITC or refundable CTC; discrepancies reflected model credit-treatment errors, not PolicyEngine errors.
US health coverage (Medicaid/CHIP)
Reviewed threshold-cluster suspects; all dissolved against 42 CFR 435 pathway rules (aged/disabled income tests, tax-dependent household composition, CHIP’s exclusion of Medicaid-eligible children) confirmed in engine traces.
US SNAP, SSI, and school meals
Reviewed false-zero suspects; references confirmed against categorical-eligibility, aged/blind/disabled, and universal-free-meal rules. One SNAP cell traced to a scenario encoding that omits the disability its prompt implies (disclosed under Limitations).
US state and local income tax
Reviewed state-rule and bracket suspects; most applied wrong schedules or missed conformity elections and forgiveness programs. One genuine defect: New Jersey’s filing-threshold floor was bypassed on the benchmarked path (fixed, policyengine-us #8845).
US Head Start eligibility
Two flags reflected a genuine age-window defect (fixed, policyengine-us #8846); references regenerated with the fix.
US payroll and overtime
Reviewed during development; upstream data fixes and prompt clarifications were applied before the frozen snapshot.
Table 5: Exhaustive annotation coverage for scored misses in the frozen snapshot.
Country
Wrong rows audited
LLM response errors
Parse-contract failures
Unresolved prompt/reference rows
Missing row annotations
Missing case notes
US
6031
5466
565
0
0
0
Total
6031
5466
565
0
0
0
Results
United States leaderboard
The US leaderboard for the frozen manuscript snapshot is shown in Table 6. The top three models in that snapshot are GPT-5.6 Sol (88.7 exact, 95% CI 85.8–91.2; 90.9 within-1%), GPT-5.6 Luna (84.5 exact, 95% CI 81.8–87.1; 86.1 within-1%), and GPT-5.5 (83.5 exact, 95% CI 80.6–86.3; 85.3 within-1%).
Table 6: Top US benchmark models in the frozen manuscript snapshot, ranked by the headline exact-match rate with the within-1% near-miss companion alongside. Exact 95% CIs and rank ranges are household-resampling bootstrap intervals (see Uncertainty).
Model
Exact %
Exact 95% CI
Exact rank
Within 1% %
Within 10%
Bounded score
0
GPT-5.6 Sol
88.7
85.8–91.2
1
90.9
93.7
95.3
1
GPT-5.6 Luna
84.5
81.8–87.1
2–4
86.1
90.7
92.5
2
GPT-5.5
83.5
80.6–86.3
2–4
85.3
90.4
93.3
3
GPT-5.6 Terra
83.4
80.4–86.3
2–4
85.3
90.8
93.7
4
Grok 4.5
80.9
77.6–84.0
4–6
81.8
86.3
91.5
Uncertainty
Each leaderboard score is a mean over a sample of 100 households, so the rankings carry sampling uncertainty. We quantify it with a household-level bootstrap: the 100 households are resampled with replacement 10,000 times, and each model’s population-weighted exact-match rate is recomputed on every resample. The resampling unit is the household, carried with its full output vector, so within-household correlations across outputs are preserved. The same resampled set is used for every model in each replicate (a paired bootstrap), so the rank ranges in Table 6 reflect genuine ordering uncertainty rather than independent per-model noise.
Sampling uncertainty is substantial at this sample size. In the frozen snapshot, 3 of the other 23 models have an exact-match 95% interval that overlaps the leader’s. Small differences in the leaderboard ordering should therefore be read as ties rather than as a strict ranking, and the rank-range column makes the set of plausible positions explicit. These intervals are a manuscript artifact: the public leaderboard and app report point estimates only, because the benchmark sample, not run-to-run model variation, is the dominant source of uncertainty here.
Cost and latency
Accuracy is one axis; the price and speed of a no-tools answer are another. Table 7 reports each model’s estimated cost to compute one household’s full output vector and its median per-household latency, next to the headline exact rate. Per-household cost spans \\\\$0.002 (GPT-5.4 nano) to \\\\$0.541 (Claude Fable 5), and median per-household latency 3 s (Gemini 3.1 Flash Lite Preview) to 170 s (DeepSeek V4 Pro). Neither dimension cleanly tracks accuracy: the top-scoring model, GPT-5.6 Sol at 88.7% exact, sits mid-pack at \\\\$0.090 per household and 36 s.
Table 7: Estimated cost and median latency per household for the frozen US snapshot, alongside the headline exact-match rate. Cost is reconstructed from logged token usage at provider list prices; latency is the median across households of each household’s summed request time. An em dash marks usage or wall-clock latency that was not measured per call.
Model
Exact (%)
Cost / household
Latency (median)
0
GPT-5.6 Sol
88.7
\$0.090
36 s
1
GPT-5.6 Luna
84.5
\$0.019
14 s
2
GPT-5.5
83.5
\$0.262
—
3
GPT-5.6 Terra
83.4
\$0.039
19 s
4
Grok 4.5
80.9
\$0.073
112 s
5
Claude Fable 5
79.9
\$0.541
98 s
6
Gemini 3.1 Pro Preview
77.9
\$0.085
45 s
7
Claude Opus 4.7
77.4
\$0.293
53 s
8
Grok 4.3
77.2
\$0.015
22 s
9
Claude Sonnet 4.6
77.1
\$0.186
114 s
10
Gemini 3 Flash Preview
76.9
\$0.048
58 s
11
Gemini 3.5 Flash
76.2
\$0.056
24 s
12
Grok Build 0.1
76.1
\$0.045
135 s
13
Gemini 3.1 Flash Lite Preview
76.1
\$0.002
3 s
14
DeepSeek V4 Pro
76.1
\$0.011
170 s
15
Qwen3.7-max
73.6
\$0.139
—
16
GLM-5.2
73.1
\$0.082
—
17
Claude Opus 4.8
72.6
\$0.255
55 s
18
MiniMax M3
72.4
\$0.007
—
19
Claude Haiku 4.5
71.7
\$0.055
48 s
20
GPT-5.4 mini
70.5
\$0.006
5 s
21
Claude Sonnet 5
69.4
\$0.172
64 s
22
Kimi K2.6
64.6
\$0.391
—
23
GPT-5.4 nano
62.3
\$0.002
6 s
Cost is reconstructed from each call’s logged prompt and completion tokens at provider list prices through litellm; for grok-build-0.1, which litellm’s price map did not yet cover, we apply the provider’s published rate of $1 and $2 per million input and output tokens. Latency is wall-clock request time as observed by the harness, summed within each household and taken as the median across the 100 households. The per-call timer spans any provider-side retry or rate-limit backoff, so the median is reported in preference to the mean, which a few throttled calls inflate. Latency is not comparable across serving regimes: Claude-family models issue chunked serial calls that lengthen wall-clock time, several models ran through batch or asynchronous dispatch whose logged times reflect submission rather than generation (shown as —), and Claude Fable 5’s usage and latency are recorded at the run level rather than per call. Both cost and latency are properties of this run’s providers, prompts, and serving configurations at evaluation time rather than fixed model constants.
Simple baselines
Simple baselines help interpret score levels in a zero-heavy benchmark. Table 8 reports an always-zero response and a median-reference-by-output response on the same frozen household sample, scored with the household-impact weighting. These are not model competitors; they show how much of each metric can be earned without household-specific policy calculation. The always-zero baseline scores 66.9% on the headline exact-match rate — below the 84% of outputs that are exact zeros because the weighting concentrates mass in high-dollar output groups that are rarely zero (Section 3.1). The top model clears the baseline by 21.8 points, and the within-1% companion shows the same separation with near-miss tolerance.
Table 8: Simple baseline scores on the frozen manuscript snapshot, household-impact-weighted. The always-zero exact rate sits below the unweighted zero share because the weighting concentrates on high-dollar output groups that are rarely zero.
Baseline
Exact %
Within 1% %
Bounded score
0
Always zero
66.9
66.9
66.9
1
Median reference by output
61.0
61.0
64.3
Sensitivity to benchmark view
The primary leaderboard gives each household equal weight. Table 9 reports several alternative views, including the older equal-output-group score. The top model is stable across several views, but lower ranks move across sensitivity views. Scores are therefore best read with the weighting choice visible rather than collapsed into a single ordering.
Table 9: Leaderboard sensitivity to alternative scoring views.
View
Rank 1
Rank 2
Rank 3
0
Exact-match headline
GPT-5.6 Sol (88.7)
GPT-5.6 Luna (84.5)
GPT-5.5 (83.5)
1
Within-1% companion
GPT-5.6 Sol (90.9)
GPT-5.6 Luna (86.1)
GPT-5.5 (85.3)
2
Bounded score
GPT-5.6 Sol (95.3)
GPT-5.6 Terra (93.7)
GPT-5.5 (93.3)
3
Equal-output-group score
GPT-5.6 Sol (96.8)
GPT-5.5 (95.6)
GPT-5.6 Terra (95.6)
4
Amount outputs only
GPT-5.6 Sol (95.3)
GPT-5.5 (94.5)
GPT-5.6 Terra (93.5)
5
Positive reference cases only
GPT-5.5 (85.8)
Gemini 3.5 Flash (83.7)
GPT-5.6 Sol (81.5)
6
Zero reference cases only
GPT-5.6 Sol (98.6)
GPT-5.6 Terra (98.3)
Gemini 3.1 Pro Preview (98.1)
The bounded score is a global-output-weighted average of row scores. Amount outputs use max(0, 1 − |pred − ref| / |ref|) when the reference is nonzero and 1{pred = 0} when the reference is zero. Binary outputs use exact 0/1 matching. The exact-match rate uses the same weighting and aggregation but replaces the amount row score with the headline indicator: 1{|pred − ref| ≤ 1} (one currency unit). Each output group’s default household-impact weight is computed from a full weighting population, not from the 100 benchmark households: the certified PolicyEngine US populace dataset. For each source household, the share is |ref_ij| / max(|household_net_income_i|, Σ_k |ref_ik|); shares are averaged with calibrated household weights and renormalized so output weights sum to one. The max(...) denominator anchors per-household shares to net income when net income is the dominant flow and falls back to the gross tax-benefit flow only when programs cancel each other out, so a $1 benefit to a high-earner contributes essentially zero weight and per-household shares never exceed one. Booleans carry weight through PolicyEngine’s paired per-capita value (for example medicaid_value), so eligibility calls are graded as accuracy but weighted by the dollar stake. Table 10 compares the bounded-score ranking against two opt-in alternatives shown for transparency: equal weighting (every output the same) and budget-weighted (each output’s share of total absolute reference dollars in the same full weighting population).
Table 10: Top country ranks under the bounded secondary metric across three weightings (household, equal, budget).
Weighting
Rank 1
Rank 2
Rank 3
0
Household-weighted (default)
GPT-5.6 Sol (95.3)
GPT-5.6 Terra (93.7)
GPT-5.5 (93.3)
1
Equal weights
GPT-5.6 Sol (96.4)
GPT-5.5 (95.4)
GPT-5.6 Terra (95.3)
2
Budget-weighted
GPT-5.6 Sol (94.5)
GPT-5.6 Terra (92.3)
GPT-5.5 (91.8)
Hardest benchmark targets
The lowest-scoring US variables are multi-step tax quantities and sparse positive-dollar benefits. As shown in Table 11, federal income tax before refundable credits, state income tax before refundable credits, state refundable credits, SNAP, and federal refundable credits are the hardest US outputs by bounded score in the frozen manuscript snapshot.
Table 11: Hardest US variables by bounded score (the secondary tracking metric, used here because it orders the hardest variables differently from the hit rates and separates them more finely; on their positive-reference cases the hit rates collapse toward single digits — see the zero-versus-positive table).
Variable
Score
Exact
Within 1%
Within 10%
0
federal_income_tax_before_refundable_credits
75.2
49.1
51.4
61.3
15
state_income_tax_before_refundable_credits
77.3
53.6
55.4
65.8
16
state_refundable_credits
80.6
77.5
77.6
78.3
13
snap
83.8
76.9
77.8
81.0
1
federal_refundable_credits
87.8
82.3
83.0
85.5
Zero and positive cases
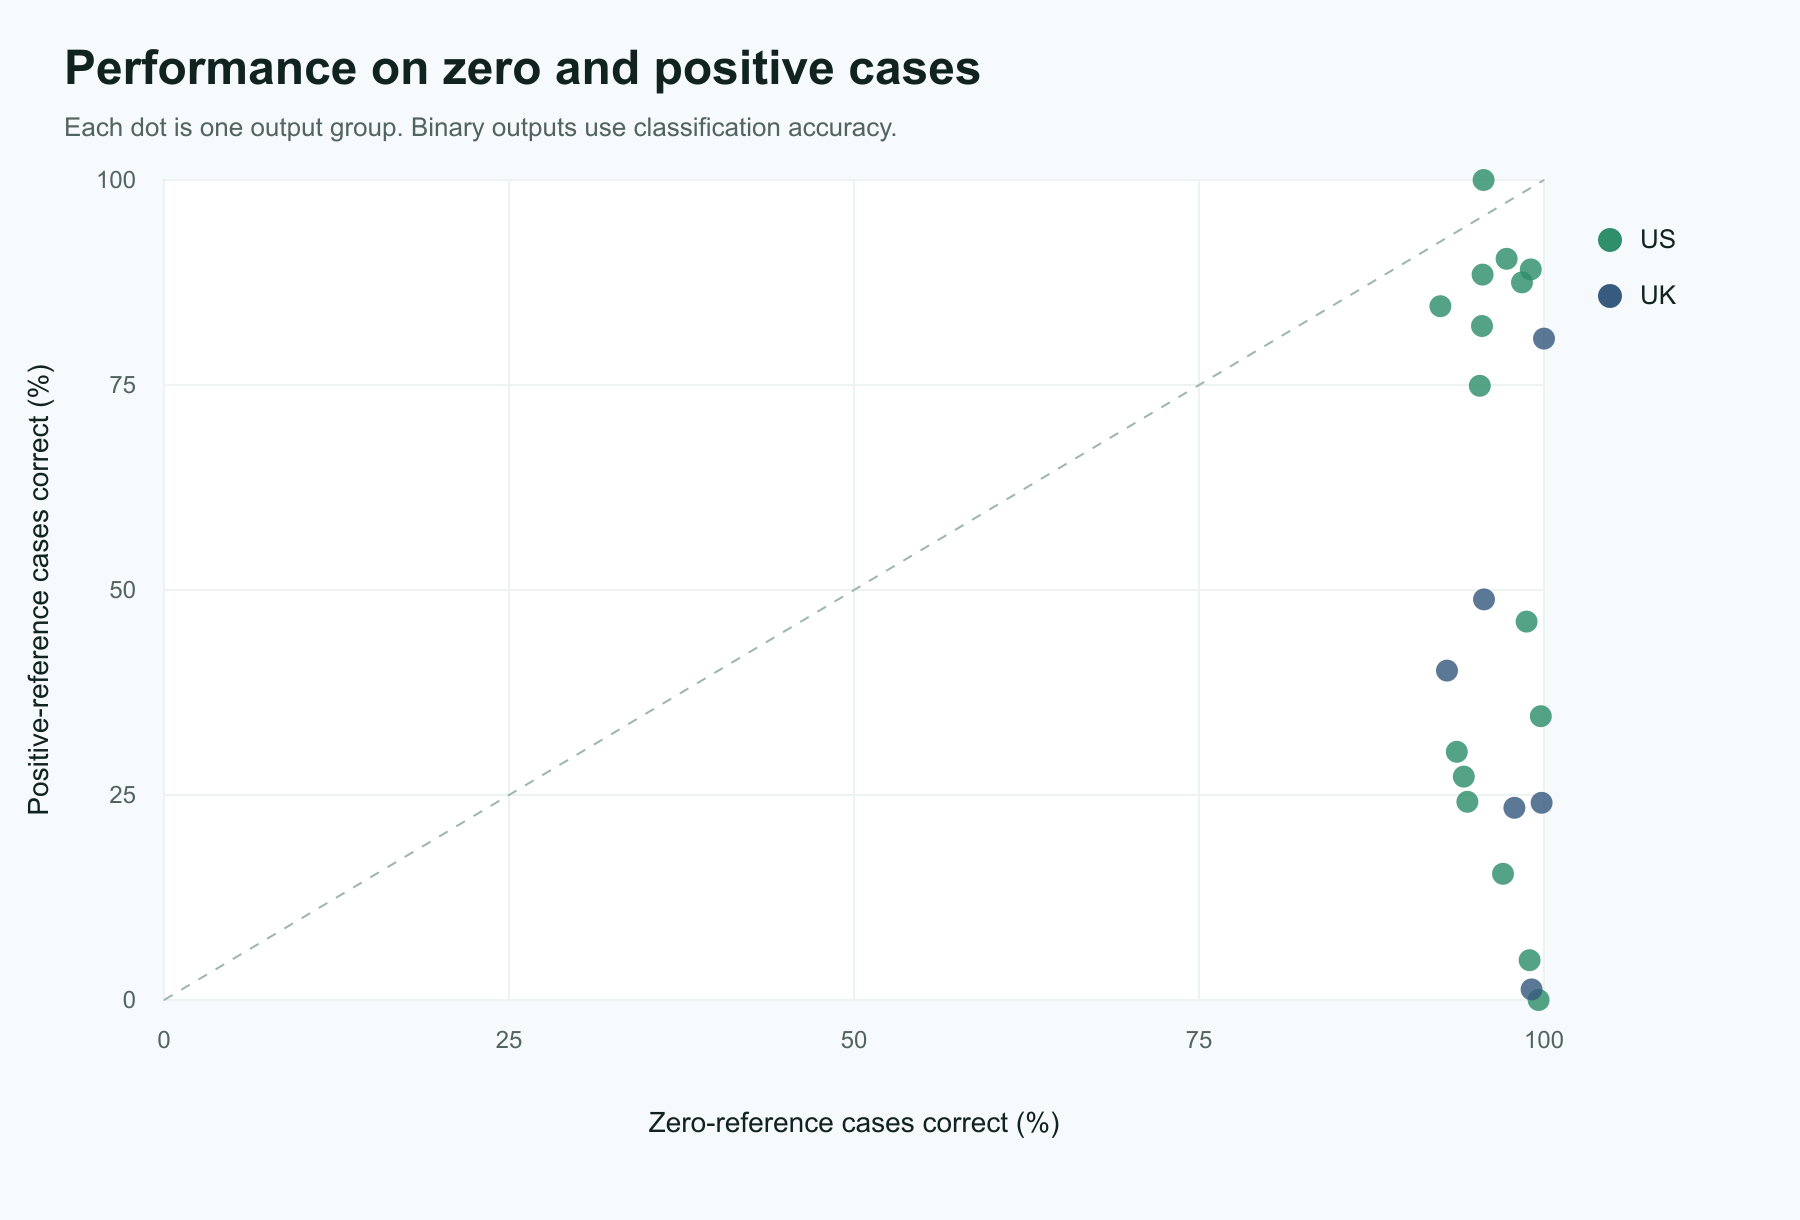
Overall hit rates can overstate performance on sparse programs because correct zeros are common. Table 12 therefore reports within-10% performance for all cases, positive-reference cases, and zero-reference cases. The gap is large for several outputs: models often identify that a program or tax does not apply, but miss the amount when the reference value is positive. Figure 1 plots the same split by output group.
Table 12: US within-10% performance by zero versus positive reference cases.
Variable
All cases
Positive cases
Zero cases
0
federal_income_tax_before_refundable_credits
62.9
33.2
89.6
1
state_income_tax_before_refundable_credits
67.2
35.1
90.7
2
state_refundable_credits
79.9
8.8
98.7
3
snap
81.6
21.4
96.3
4
federal_refundable_credits
87.8
40.7
94.7
5
payroll_tax
89.1
84.4
97.2
6
person_medicaid_eligible
89.3
77.6
92.9
7
person_medicare_eligible
95.6
99.5
94.5
Figure 1: Output-level performance on zero-reference and positive-reference cases.
Failure modes
The benchmark surfaces a few recurring failure patterns.
First, models miss positive tax and benefit quantities more often than zero cases. The lowest-scoring outputs by bounded score (Table 11) require the model to choose the right income concepts, exclusions, program thresholds, and sequencing before applying any final subtraction. Positive benefit cases remain difficult, so the result should not be read as a general claim that benefits are easy.
Second, joint accuracy across interacting components is lower than marginal accuracy on either component. Table 13 shows within-10% accuracy for federal_refundable_credits, state_refundable_credits, and the conjunction of both within the same household. The joint hit rate can be no higher than either marginal and is strictly lower for all but the top model, so leaderboard scores that average across outputs understate how often a model gets a single household’s federal/state credit allocation jointly correct.
Table 13: US within-10% accuracy on federal vs state refundable credits and the household-level joint.
Model
Federal within 10%
State within 10%
Joint within 10%
16
GPT-5.6 Sol
99.0
86.0
86.0
14
GPT-5.5
95.0
85.0
82.0
7
Gemini 3 Flash Preview
92.0
82.0
78.0
17
GPT-5.6 Terra
95.0
79.0
77.0
0
Claude Fable 5
91.0
82.0
76.0
19
Grok 4.5
92.0
78.0
76.0
6
DeepSeek V4 Pro
90.0
80.0
76.0
9
Gemini 3.1 Pro Preview
90.0
82.0
76.0
15
GPT-5.6 Luna
94.0
79.0
76.0
10
Gemini 3.5 Flash
90.0
79.0
74.0
4
Claude Sonnet 4.6
93.0
79.0
73.0
8
Gemini 3.1 Flash Lite Preview
86.0
79.0
73.0
20
Grok Build 0.1
88.0
78.0
72.0
13
GPT-5.4 nano
86.0
79.0
72.0
3
Claude Opus 4.8
84.0
79.0
70.0
18
Grok 4.3
84.0
79.0
70.0
12
GPT-5.4 mini
81.0
79.0
69.0
5
Claude Sonnet 5
80.0
79.0
68.0
2
Claude Opus 4.7
85.0
78.0
67.0
22
MiniMax M3
80.0
79.0
67.0
11
GLM-5.2
80.0
72.0
65.0
1
Claude Haiku 4.5
75.0
79.0
64.0
23
Qwen3.7-max
78.0
79.0
63.0
21
Kimi K2.6
45.0
48.0
29.0
Third, structured-output reliability is part of the benchmark contract. Missing or unparseable numeric values are not dropped. Appendix A documents parser recovery and the supervised runner’s bounded retry rounds; the 565 cells (1.2%) that still returned no parsable value after retries stand in the canonical files and score zero as parse-contract failures (Appendix A gives the per-model breakdown).
Limitations
PolicyBench is not a substitute for a production tax-and-benefit calculator. Several caveats matter:
output-contract reliability required a repair workflow; raw provider responses, including failed attempts, are retained within the canonical prediction files, and cells that never parsed score zero
zero-heavy outputs require separate positive-case interpretation
the choice of headline metric (exact match), near-miss companion (within-1%), and secondary tracking metric (bounded score) is one benchmark view; all three are reported, but downstream evaluations should also consider error-magnitude metrics (mean absolute error, mean absolute percentage error) where appropriate
the public scenario explorer exposes the current test set and reference outputs, so open-set leakage is a prominent limitation rather than a minor implementation detail
the 100-household manuscript snapshot should be treated as a preview until larger frozen runs are published
the scored-miss audit is exhaustive over this frozen snapshot, but it is developer-adjudicated and not an independent validation of every reference value
one frozen scenario encodes household inputs that do not match its prompt narrative (a South Carolina household whose prompt implies a qualifying disability the inputs omit), and two input-semantics conventions (SSI disability status and adult tax-dependent relationships) are under-specified in ways a scheduled scenario refresh will address; affected cells score models against the encoded inputs
benchmark success should not be interpreted as policy-advice readiness
The current paper is therefore an evaluation of model performance under a specific structured-output benchmark, not a general certification of tax or benefit competence.
Conclusion
PolicyBench shows a consistent pattern across the US benchmark. Models often identify non-applicability, but positive tax and benefit amounts remain difficult, especially for multi-step income tax and positive benefit cases. In the frozen manuscript snapshot, GPT-5.6 Sol is the top-scoring US model.
These results support a narrow conclusion: unaided frontier models still struggle to reproduce selected household-level microsimulation outputs under a structured public benchmark. They do not show that models cannot assist policy analysis, and they do not validate PolicyEngine outputs as administrative truth. They suggest that future evaluations should separate no-tool estimation, tool-using system design, and reference-output validation more explicitly.
Next steps are to expand country coverage, increase frozen sample sizes, and add protected or rotating evaluation sets so that public rankings are less exposed to open-set leakage. The benchmark should also continue reporting sensitivity views, because scores are useful summaries only when their weighting choices are visible.
Appendix A: Structured-output audit
The benchmark requires one numeric value and one explanation for every requested output. Parse failures are benchmark failures, not missing data to drop from the denominator. Before publishing the manuscript snapshot, we audited missing numeric values and explanations, extended the parser only where explicit variable-keyed value and explanation fields were recoverable, and retried failing scenarios under the supervised runner’s bounded rounds. Table 14 summarizes that sequence.
Table 14: Structured-output parser audit and repair sequence.
Step
Finding
Initial parse-contract audit
The source run was audited for rows missing a parsed numeric value or non-empty explanation; those rows were not dropped from the denominator.
Parser repair
The parser was extended to recover explicit value and non-empty explanation blocks from nested, escaped, or partially truncated provider JSON without scraping prose numbers.
Retry policy
Later waves ran under a resumable supervised runner that retries failed or timed-out scenarios in bounded rounds; every model’s canonical file covers all 100 households. No separate whole-response retry artifacts exist for this snapshot.
Final parse coverage
565 of the 47,616 canonical model-output rows (1.2%) have no parsable numeric value despite retries — 426 from Kimi K2.6 and 139 from GLM-5.2 — and score zero as parse-contract failures. Every other row has a parsed numeric value and a non-empty explanation.
Preservation rule
The snapshot retains the raw provider responses in the compressed source-run prediction files, including the responses behind unparsable rows.
Model waves after June ran under a resumable supervised runner that retries failed or timed-out scenarios in bounded rounds, so no separate retry artifacts exist; repairs are folded into each model’s canonical prediction file. After retries, 565 cells (1.2% of canonical rows, concentrated in Kimi K2.6 and GLM-5.2) still returned no parsable numeric value. These stand in the canonical files with their raw responses preserved and score zero as parse-contract failures — the denominator is never reduced.
Competing interests
The author leads PolicyEngine, which develops the microsimulation software used to produce the benchmark reference outputs, and is a founder of the Axiom Foundation, a nonprofit developing deterministic rules-as-code infrastructure. Both organizations’ missions are advanced by the finding that unaided language models do not reliably reproduce rule calculations.
Abbood, Auss, Zaiqiao Meng, and Nigel Collier. 2025. “Time to Revisit Exact Match.”Findings of the Association for Computational Linguistics: EMNLP 2025 (Suzhou, China), 11903–26. https://doi.org/10.18653/v1/2025.findings-emnlp.637.
Bock, Michael R., Kara Molisee, Zachary Ozer, and Sumit Shah. 2025. “TaxCalcBench: Evaluating Frontier Models on the Tax Calculation Task.”arXiv Preprint arXiv:2507.16126, ahead of print. https://doi.org/10.48550/arXiv.2507.16126.
Chen, Zhiyu, Wenhu Chen, Charese Smiley, et al. 2021. “FinQA: A Dataset of Numerical Reasoning over Financial Data.”arXiv Preprint arXiv:2109.00122. https://arxiv.org/abs/2109.00122.
Cobbe, Karl, Vineet Kosaraju, Mohammad Bavarian, et al. 2021. “Training Verifiers to Solve Math Word Problems.”arXiv Preprint arXiv:2110.14168. https://arxiv.org/abs/2110.14168.
Guha, Neel, Julian Nyarko, Daniel E. Ho, et al. 2023. “LegalBench: A Collaboratively Built Benchmark for Measuring Legal Reasoning in Large Language Models.”arXiv Preprint arXiv:2308.11462. https://arxiv.org/abs/2308.11462.
Hendrycks, Dan, Collin Burns, Saurav Kadavath, et al. 2021. “Measuring Mathematical Problem Solving with the MATH Dataset.”NeurIPS Datasets and Benchmarks Track. https://arxiv.org/abs/2103.03874.
Holzenberger, Nils, Benjamin Van Durme, Sarah Lawsky, and Kyle Richardson. 2021. “Factoring Statutory Reasoning as Language Understanding Challenges.”arXiv Preprint arXiv:2105.07903. https://arxiv.org/abs/2105.07903.
Shanahan, Catherine, Emma McCarthy, Yan Zhao, et al. 2025. “Performance of LLMs on VITA Test: Potential for AI-Assisted Tax Returns for Low Income Taxpayers.”Artificial Intelligence and Law, ahead of print. https://doi.org/10.1007/s10506-025-09465-7.
Shorten, Connor, Charles Pierse, Thomas Benjamin Smith, et al. 2024. “StructuredRAG: JSON Response Formatting with Large Language Models.”arXiv Preprint arXiv:2408.11061, ahead of print. https://doi.org/10.48550/arXiv.2408.11061.
Sutherland, Holly, and Francesco Figari. 2013. “EUROMOD: The European Union Tax-Benefit Microsimulation Model.”International Journal of Microsimulation 6 (1): 4–26. https://doi.org/10.34196/ijm.00075.
Zhou, Ruiwen, Wenyue Hua, Liangming Pan, et al. 2025. “RuleArena: A Benchmark for Rule-Guided Reasoning with LLMs in Real-World Scenarios.”Proceedings of the 63rd Annual Meeting of the Association for Computational Linguistics (Volume 1: Long Papers) (Vienna, Austria), 550–72. https://doi.org/10.18653/v1/2025.acl-long.27.
Zhu, Fengbin, Wenqiang Lei, Youcheng Huang, et al. 2021. “TAT-QA: A Question Answering Benchmark on a Hybrid of Tabular and Textual Content in Finance.”arXiv Preprint arXiv:2105.07624. https://arxiv.org/abs/2105.07624.